Home page David Pennock, Gary Flake, Steve Lawrence, Eric Glover, C. Lee Giles
Download the study in HTML, PDF, or PostScript formats.
Contact: Dr. David Pennock, .
"Power law" distributions |
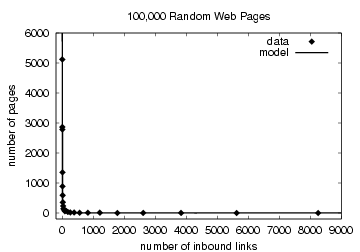
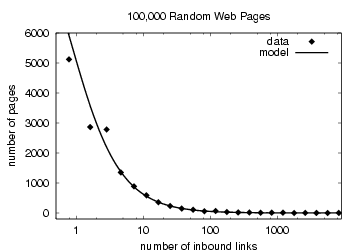
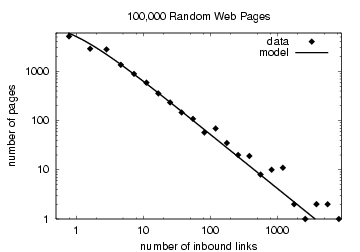
Research has shown that the distribution of links to all sites on the
web approximates a "power law", that is, a small number of sites
receive the majority of links and most sites receive very few
links. |
Publications e-commerce sites (very competitive) |
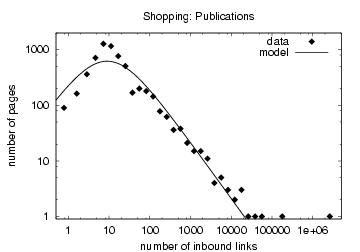
The following plot shows the observed distribution and model fit for
the publications e-commerce category (books, magazines, etc.), which
is the most competitive (most like a power law or preferential growth)
category examined. The rightmost point is for Amazon.com. Note that
the log scales on the plot compress the differences. The typical site
in the publications e-commerce category has about 2 millionths the
number of inlinks that Amazon.com has. It is interesting to compare
the competition between online businesses to that of offline
businesses - the largest market share online (for Amazon) is much
greater than the largest market share offline. |
Photographers e-commerce sites (much less competitive) |
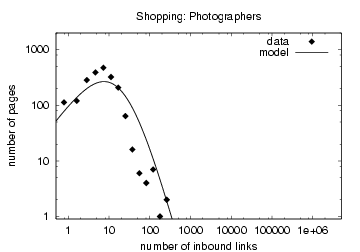
The following plot shows the observed distribution and model fit for
the photographers e-commerce category, which is the least competitive
(most like uniform growth) category examined. There are multiple
factors that can lead to the differences in competition that we
see. For photographers, one likely factor is their local nature -
photographers typically serve only a local community and those serving
different areas usually do not compete. Another factor may be that
people looking for photographers use methods other than the web more
often (e.g., referrals from friends). Perhaps because people typically
use professional photographers rarely, they are also less likely to
create and share information among related sites on the web. |
All categories |
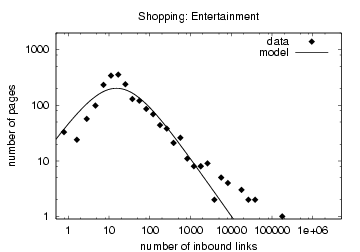
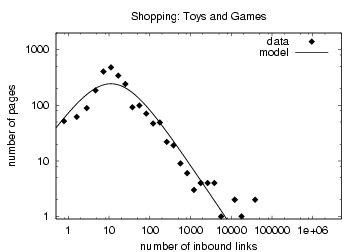
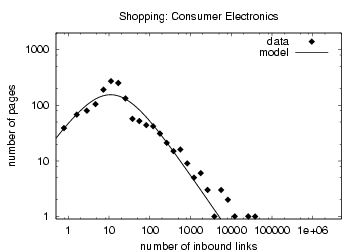
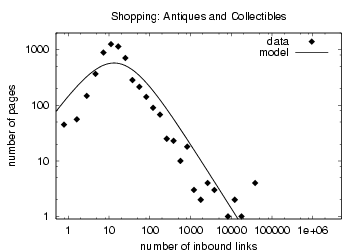
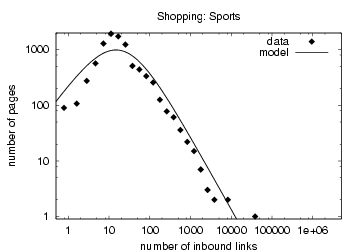
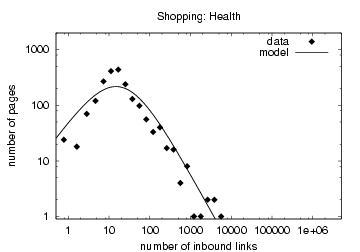
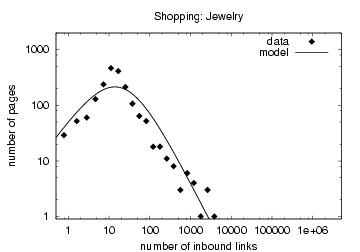
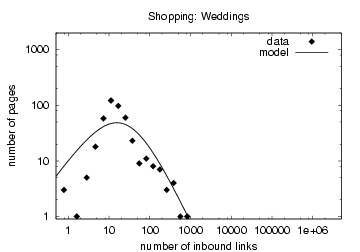
The following plots show the distributions for all of the examined
e-commerce categories, in order from the most competitive category, to
the least competitive category. Note that all of the plots differ
substantially from the distribution for all web pages shown at the top
of this page, and that the distribution changes substantially across
the categories. |
Download the study in HTML, PDF, or PostScript formats.
Contact: Dr. David Pennock, .
